This short guide will help you to continue developing your system based on AS or to figure out what is wrong if something doesn't work as expected on your server.
Debug Mode
By default, the system is configured to not display any errors. This is simply the way to protect some sensitive information that can possibly be displayed to your end users when your website is in production.
However, while developing some new features or customizing the system, it's much easier if you enable the DEBUG mode and see all the errors on the screen. To enable DEBUG mode, just edit ASEngine\AS.php and DEBUG constant to true.
Note! Always set DEBUG to false when your website is in production!
Debugging AJAX Requests
Since this script uses AJAX for communicating with the server, it's useful to know how you can debug all those ajax requests to see if something went wrong with it. The following guide is for Chrome users, but it's almost identical in any browser.
1) Open "Chrome Developer Tools" by simply clicking anywhere on the page and selecting "Inspect" from the context menu. More details and shortcuts are available here.
2) Navigate to Network tab. Here you will be able to see all HTTP request sent from your browser.
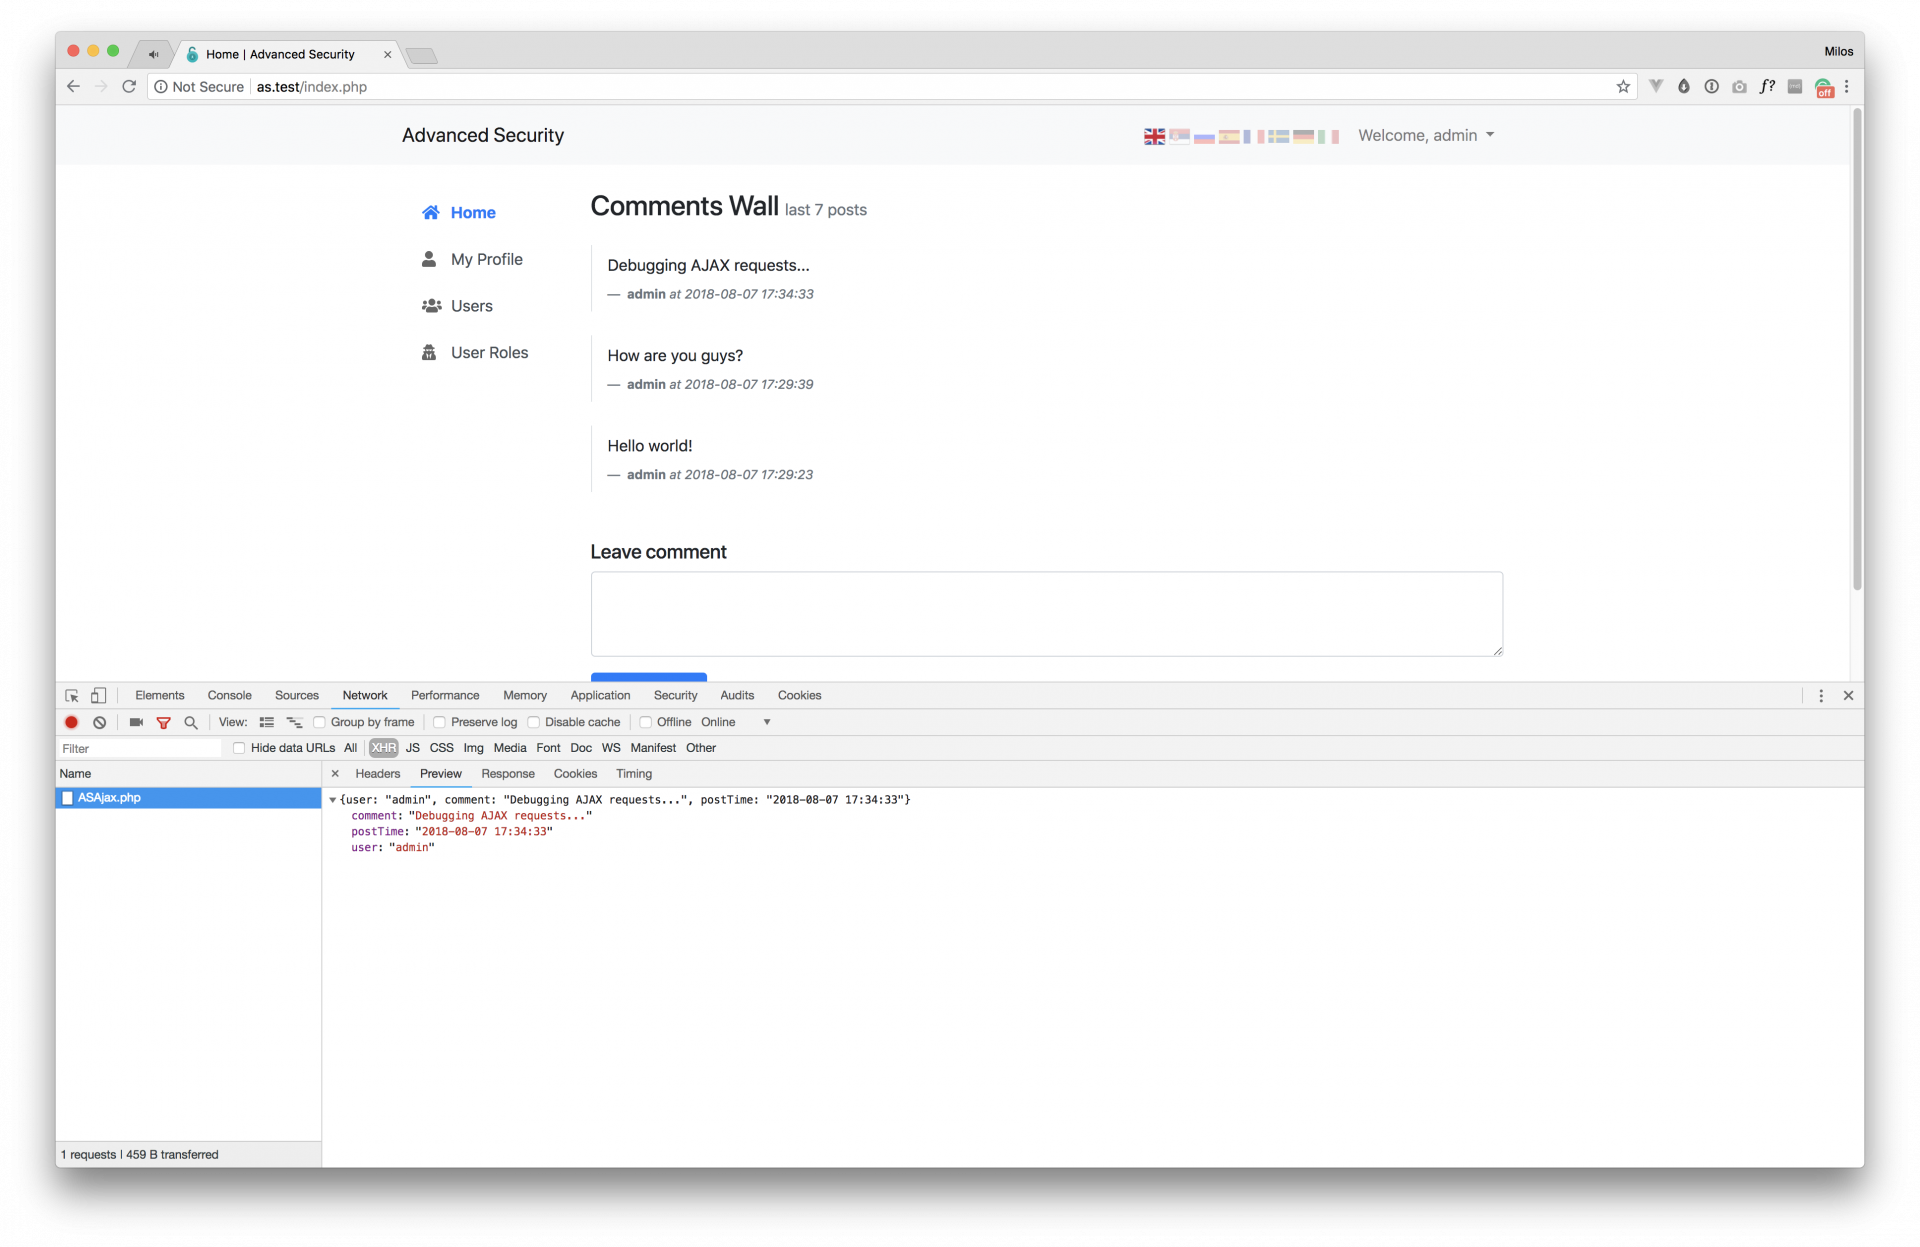
3) Perform any action inside the AS (we will add new comment for the sake of this example) and check the Request/Response info:

As you can see from that screenshot from above, you are able to see complete request and response including all headers and data. This will help you to see if the server returns everything you expect for specific HTTP Request. In case that you have debug mode enabled, and there are some PHP errors, they will be displayed here as well.

